Euronext Dublin
Euronext Dublin
Irish indices
| Index | Last | % |
|---|---|---|
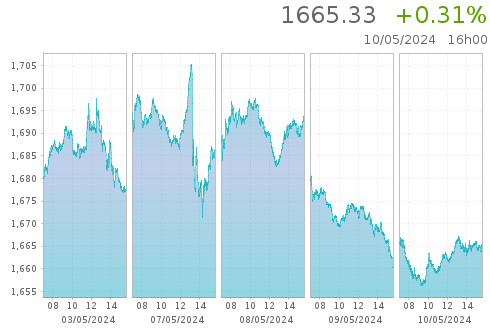
| ISEQ 20 | 1,646.45 | +1.15 % |
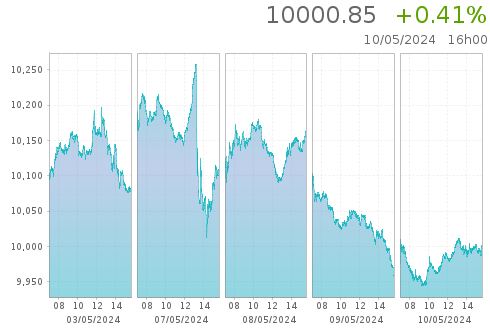
| ISEQ All Share | 9,941.69 | +1.15 % |
| ISEQ Small | 984.93 | -0.02 % |
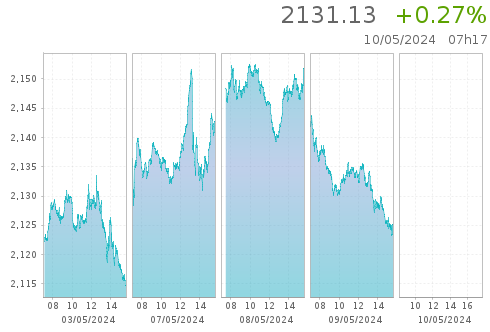
| ISEQ 20 Capped | 2,097.12 | +1.10 % |
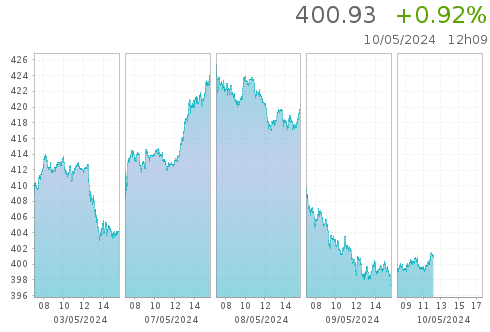
| ISEQ Financial | 408.30 | +2.32 % |
EU indices
| Instrument-name | Last-price | Day-change-relative |
|---|---|---|
| EURONEXT 100 | 1,500.80 | +0.41 % |
| CLIMATE EUROPE | 1,880.80 | +0.34 % |
| LOW CARBON 100 | 159.82 | +0.15 % |
| NEXT BIOTECH | 2,049.07 | +0.32 % |
| ESG 80 | 2,042.35 | +0.52 % |
Currency rates
| Instrument-name | Last-price | Day-change-relative |
|---|---|---|
| EUR / USD | 1.06391 | -0.05 % |
| EUR / GBP | 0.85599 | +0.03 % |
| EUR / JPY | 164.486 | -0.05 % |
| EUR / CHF | 0.97006 | -0.12 % |
| GBP / USD | 1.2429 | -0.07 % |
Irish indices
ISEQ 20
ISEQ ALL SHARE
ISEQ CAPPED
ISEQ FINANCIAL
ISEQ SMALL
Cash Products
More Euronext Dublin
Learn more about our Dublin markets
Visit our Dublin page on Euronext.com and learn about our Dublin offering.
